|

USGS WaterWatch Toolkit
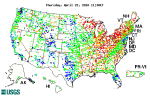
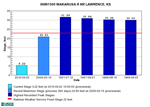
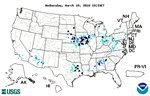
WaterWatch Streamflow Conditions Map Builder
This builder is used to customize the streamflow conditions maps (e.g., thumbnail, different size, and different background colors, etc.).
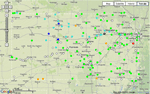
A Google Maps version of the streamflow conditions map can be created. This map has pan and zoom functionality.
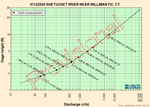
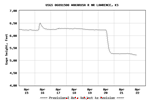
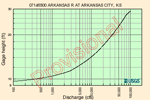
The rating curve builder is used to create a USGS streamflow rating curve. The rating table is from the USGS ratings depot. Field measurements can also be appended to the curve.
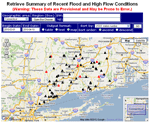
Summary of Flood and High Flow
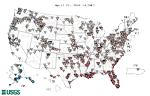
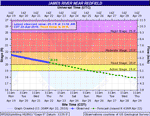
This tool summarizes the flood and high flow conditions for a state or a region for a given time period. Tables and Google Maps are used to summarize conditions and to show locations, respectively.
Streamgage Statistics Retrieval Tool
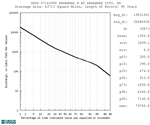
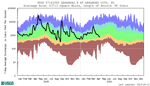
The "streamgage statistics" retrieval tool provides a list of basic summary statistics and duration graph for the selected streamgage, as computed from daily values, for the period of record.
Maps shown on WaterQualityWatch can be customized.
All of the charts shown on WaterWatch can also be shown on WSC's web pages.
This tool is to create a streamflow map animation for a time period for real-time streamflow and flood-and-high flow maps, respectively.
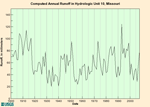
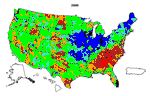
Hydrologic unit runoff and runoff condition maps from 1901 to 2008 are available.
Harry Lins
U.S. Geological Survey
415 National Center
Reston, VA 20192
Email: hlins@usgs.gov

![]() U.S. Department of the Interior |
U.S. Geological Survey
U.S. Department of the Interior |
U.S. Geological Survey
URL: https://waterwatch.usgs.gov
Page Contact Information: Contact USGS
Page Last Modified: Friday, December 19, 2025