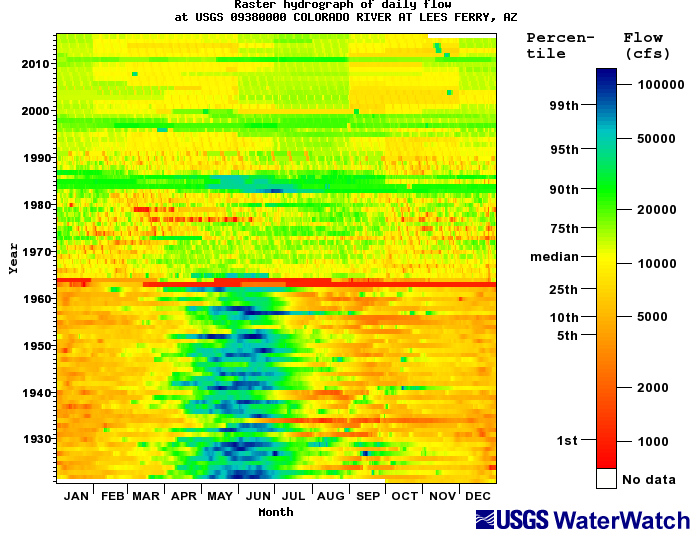
Provide pixel-based plots for visualizing and identifying variations and changes in a streamflow data set.
The raster hydrographs depict years on the y-axis and days along the x-axis.
Users can choose to plot streamflow (actual values or log values) for Daily, 7-Day, 14-Day, and 28-Day streamflow.