|
Toolkit
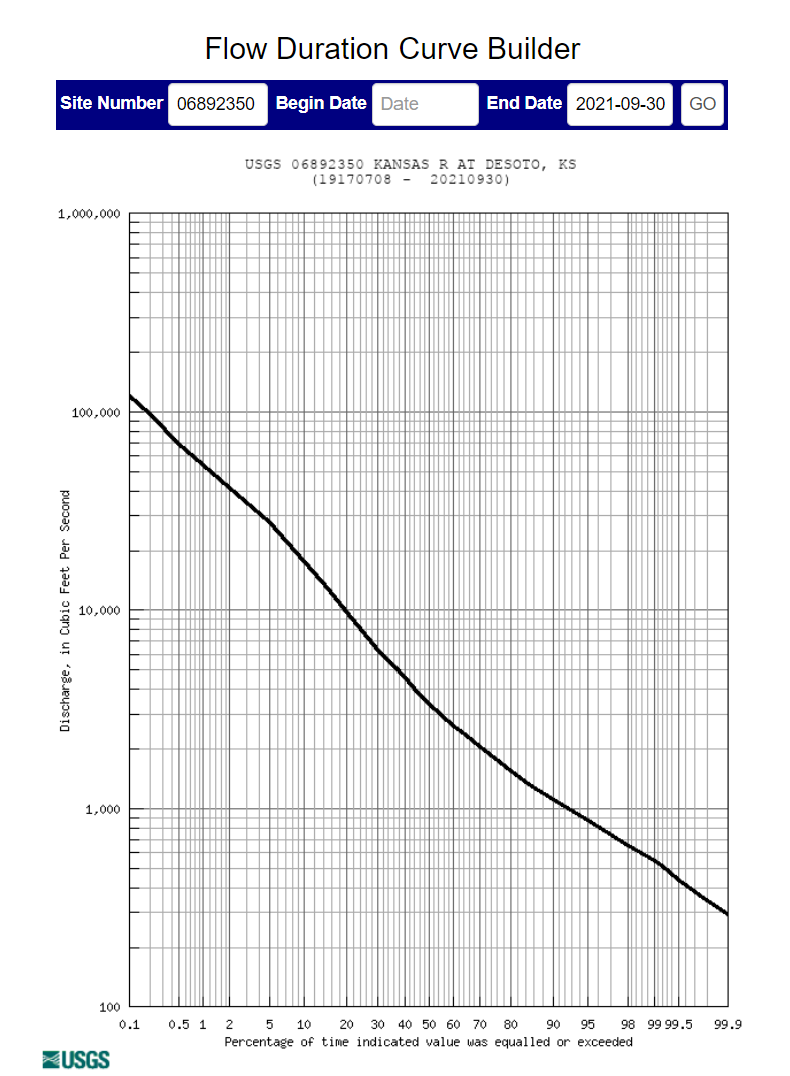
Flow Duration Curve
Create a USGS flow duration curve dynamically. Choose USGS streamgage and specify the beginning and ending dates to create a curve
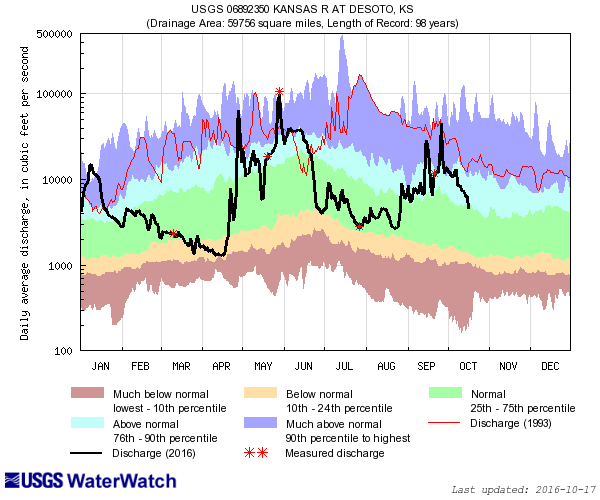
Duration Hydrograph
Present a time-history of streamflow along with historical streamflow percentiles with capabilites to
- search all UGSS sites;
- provide 'alt' color version;
- overlay historical streamflow, field measurements,and flow criteria; and
- download flow and statistics.
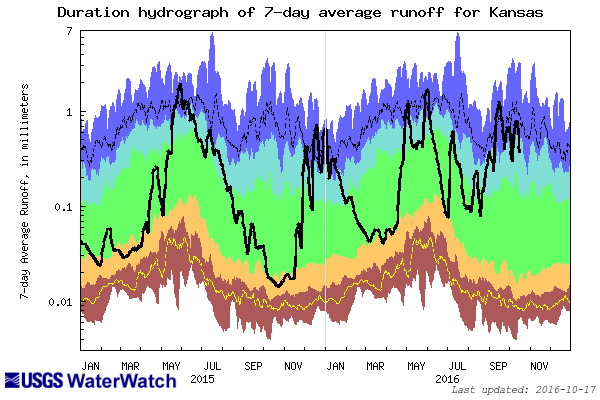
Area-based Runoff Duration Hydrograph
The area-based runoff duration hydrograph presents a time-history of area-based runoff along with historical runoff percentiles. It is used to display runoff for a state or a water-resource region. Runoff and runoff percentiles can be downloaded. Multiple year types such as water year are supported.
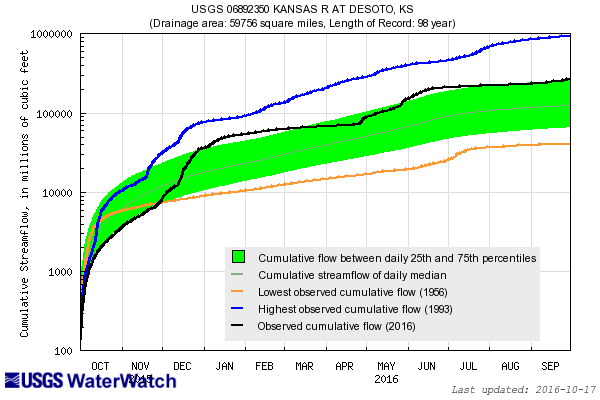
Cumulative Streamflow Hydrograph
Present a graphical presentation of recent cumulative daily streamflow at a site, plotted over the cumulative long-term statistics (median and interquartile range) of streamflow for each day of the year at that station. Observed minimum and maximum annual cumulative discharges are also plotted.
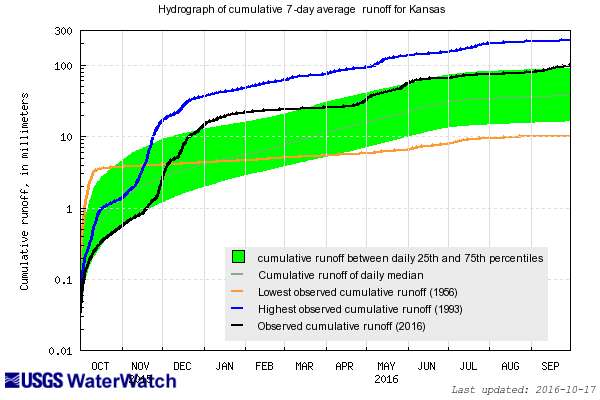
Cumulative Area-based Runoff Hydrograph
Create a graphical presentation of cumulative daily area-based runoff, plotted over the cumulative long-term statistics (median and interquartile range) of runoff for each day of the year. Observed minimum and maximum annual cumulative runoff are also plotted.
Streamflow Map Viewer
View WaterWatch dynamic maps in a place.
- View all kind of streamflow conditions maps
- Provide tools for quick zooming, panning, and full-screen.
- Search USGS streamgages easily by state, huc, and site name and number.
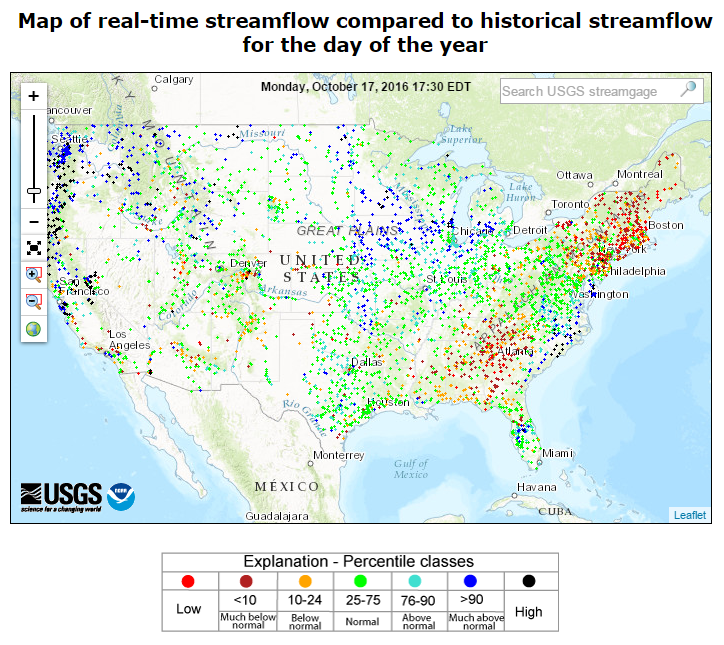
Seamless real-time streamflow map
Display a seamless dynamic real-time streamflow condition map. With zooming, more details are shown.

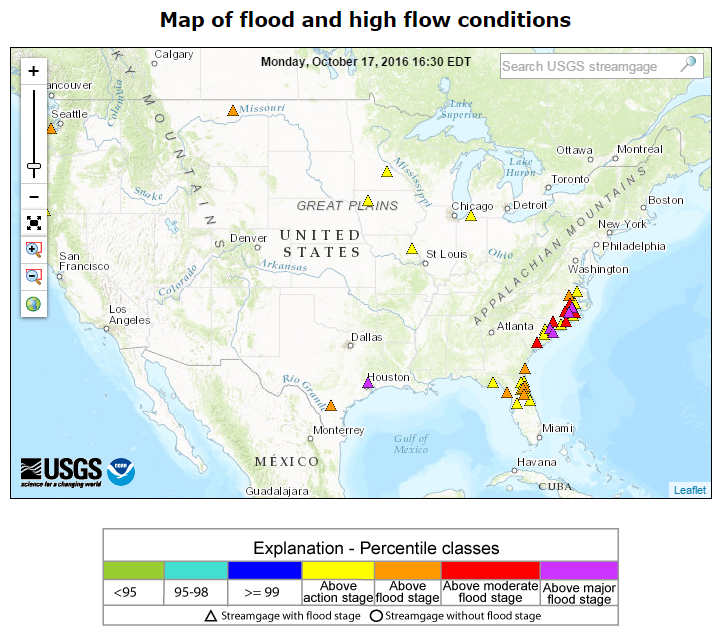
Seamless flood and high flow map
Display a seamless flood and high flow map. Map shows 4 categores of NWS flood stages: action, minor, moderate, and major.
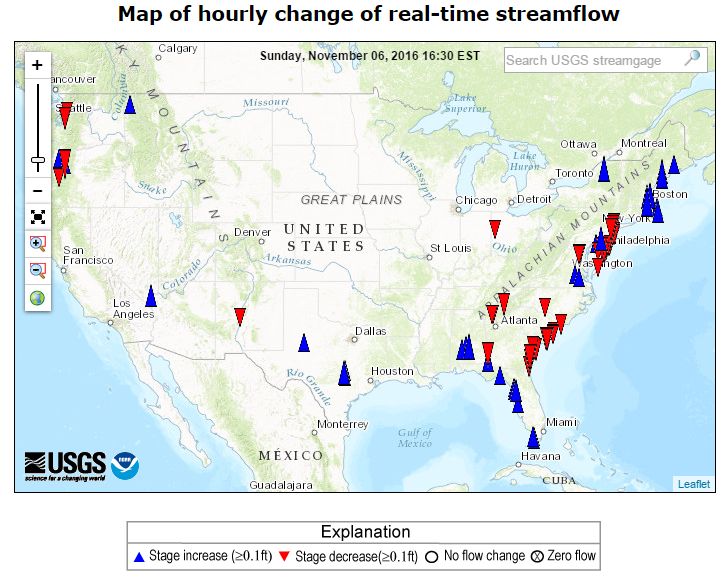
Seamless hourly flow change map
Display hourly flow change map. Highlight sites with increasing and decreasing flows.
Streamgage statistics retrieval
Provides a list of basic summary statistics and a duration graph for a streamgage, as computed from daily values, for the period of record. Download streamflow statistics for all current streamgages.
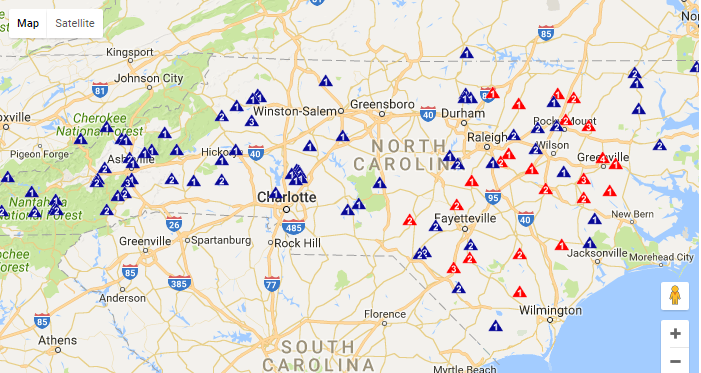
Streamflow measurements
Disaply streamflow measurements for a period and in an area. Highlight the number of measurements and the number of measurenements during flooding.
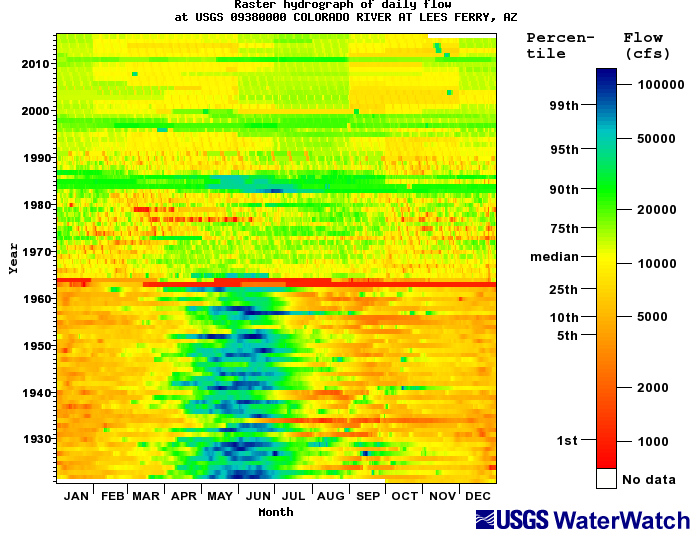
Raster hygrograph
Provide pixel-based plots for visualizing and identifying variations and changes in a streamflow data set. The raster hydrographs depict years on the y-axis and days along the x-axis. Users can choose to plot streamflow (actual values or log values) for Daily, 7-Day, 14-Day, and 28-Day streamflow.
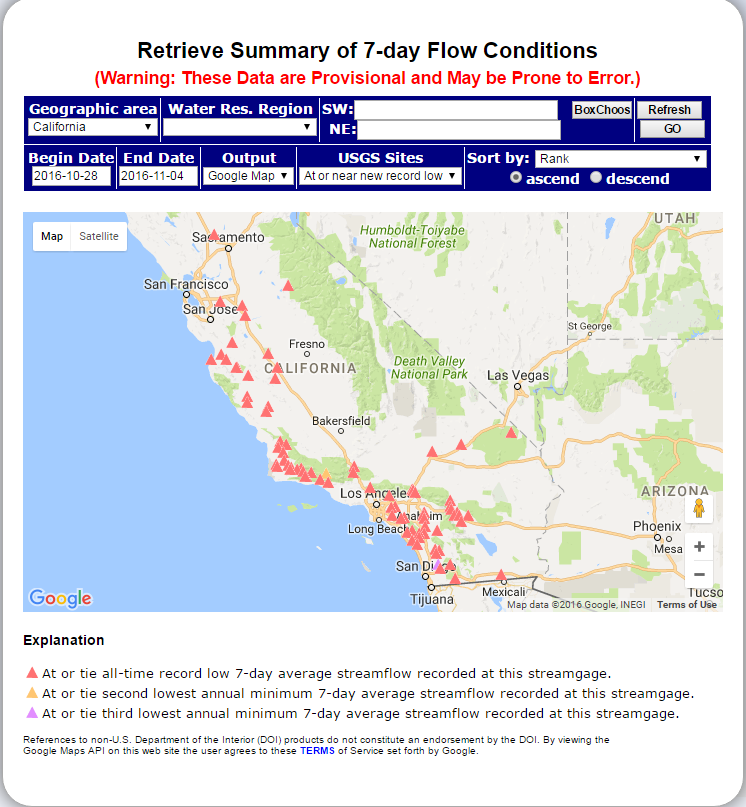
Summary of 7-day low flow conditions
Analyze 7-day low flow of an area for a specific period and provide historical comparison with
- table listing lowest 7-day flows, their ranks, and historical annual minimum 7-day flows; and
- map showing streamgages with at-or-near new record lows, zero flows, and rank information.
Streamflow conditions map
Customize the streamflow conditions maps (e.g., thumbnail, different size, and different background colors, etc.) and provide a url to be imbedded in web sites.

Streamflow Map Animation
Create a streamflow map animation for a time period for real-time streamflow and flood-and-high flow maps, respectively.

Rating Curve
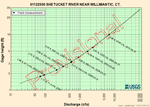
The rating curve builder is used to create a USGS streamflow rating curve. The rating table is from the USGS ratings depot. Field measurements can also be appended to the curve.
Runoff Hydrograph
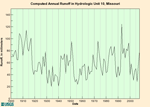
Monthly, quarterly, and annual HUC runoff time-series plots are avialable in a HUC area and a state.
Hydrologic Unit Runoff Maps
Hydrologic unit runoff and runoff condition maps from 1901 to 2020 are available.

