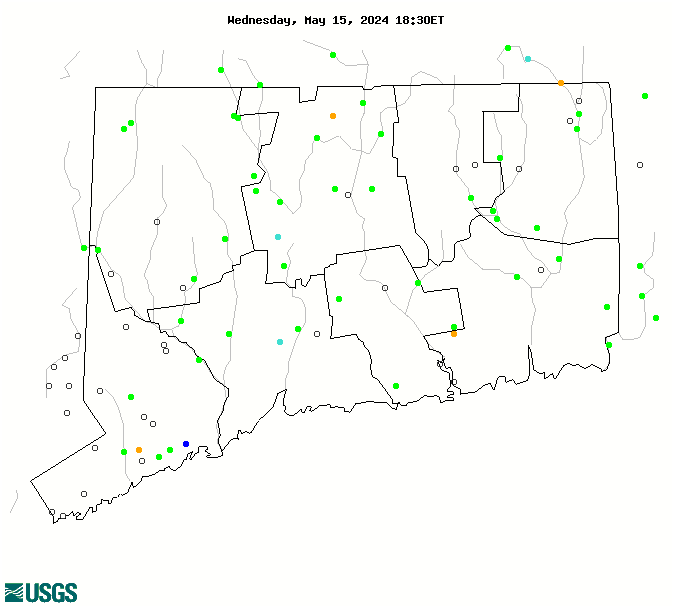
WaterQualityWatch -- Continuous Real-Time Water Quality of Surface Water in the United States

Real-Time Discharge, in cfs

Map of , showing which states provide real-time computed water-quality data
01374531 01200500 01199050 01199000 01187300 01186500 01125500 01124151 01123360 01374505 01185500 01124000 01123600 01374821 01208873 01208500 01206900 01200000 01194500 01193500 01189995 01188090 01184100 01184000 01183500 01127500 01127000 01122500 01122000 01119500 01118000 01117800 01111300 01209700 01209500 01208990 01208950 01208925 01205500 01204000 01203600 01196620 01196500 01195490 01195100 01194000 01192883 01192500 01191000 01189000 01188000 01187800 01186000 01184490 01123000 01121000 01118500 01118300 01117500 01115187 0137449480 012112296 012095493 012035055 011230695 01374890 01374781 01212500 01209901 01209788 01209761 01209510 01209105 01209005 01203805 01203510 01202501 01201487 01200600 01196561 01194796 01194750 01193050 01190070 01125490 01125100 01121330 01120790 01119382 Explanation

* Site operated on a seasonal basis or currently is not operating.
No values are available for the last 6 hours.

The "Real-time" map tracks short-term changes (over several hours) of water quality. Although the general appearance of the map changes very little from one hour to the next, individual sites may change rapidly in response to major rain events or to reservoir releases. The data used to produce this map are provisional.