WaterQualityWatch -- Continuous Real-Time Water Quality of Surface Water in the United States

Real-Time Specific Conductance, in µS/cm
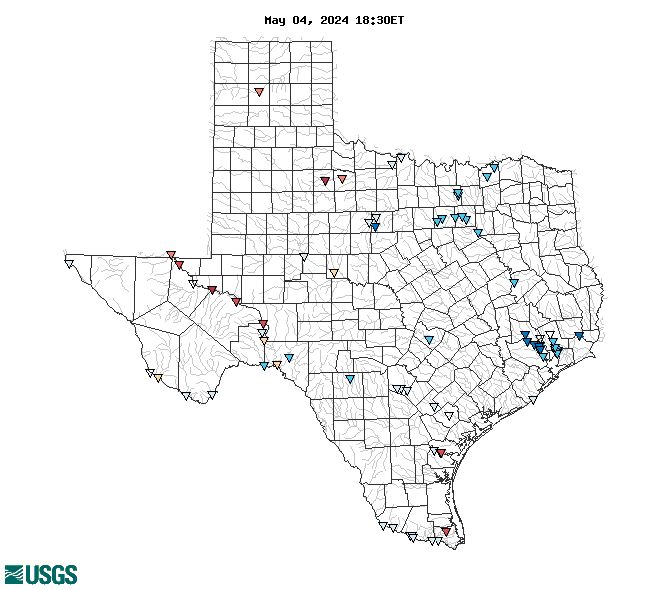
Map of , showing which states provide real-time computed water-quality data
0821150305 07311800 07311782 08446500 08437710 08412500 08447000 08470500 08407500 07227500 08374200 07312700 08117300 08447300 08126380 08123850 08117301 07312500 08447410 08473326 08211502 08086212 08181800 08469175 08465100 08467680 08473575 08447018 08375300 08086400 08180800 08377200 08462500 08188060 08211200 08467670 08374510 08181500 294643095035200 08067118 08067000 08052700 08067100 08052745 08065350 08047050 08067252 08364000 08057000 08067215 08067254 08057410 08062500 08067250 08195000 08449000 08048000 08049500 07332605 295524095072701 07332622 295826095082200 08069500 08041770 08068500 300032095080501 295554095093402 08068000 08066850 08070200 08188500 08419000 08371500 08086290 08155500 Explanation

* Site operated on a seasonal basis or currently is not operating.
No values are available for the last 6 hours.

The "Real-time" map tracks short-term changes (over several hours) of water quality. Although the general appearance of the map changes very little from one hour to the next, individual sites may change rapidly in response to major rain events or to reservoir releases. The data used to produce this map are provisional.