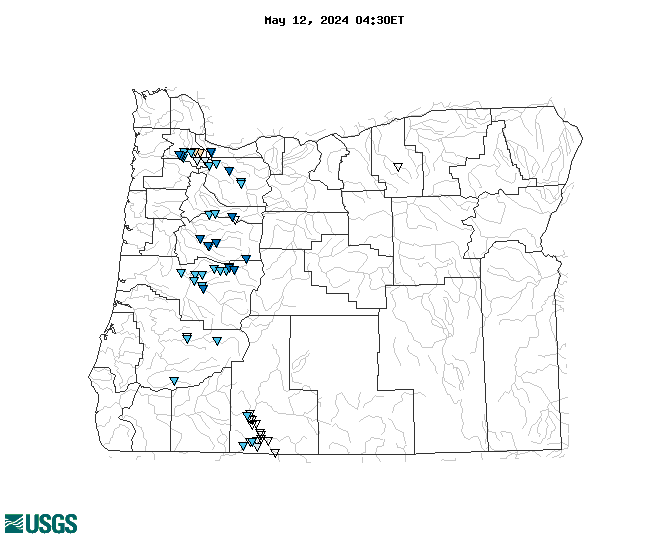
WaterQualityWatch -- Continuous Real-Time Water Quality of Surface Water in the United States

Real-Time Dissolved Oxygen, in mg/L

Map of , showing which states provide real-time computed water-quality data
14163900 452731123092100 14152000 14183020 14206950 14182500 14187200 14316460 14158850 14317450 14181500 14309000 14158100 14209710 442453122394900 14211720 14149011 14164550 14202650 14162200 14203500 14202980 14187500 453040123065201 14162500 14211010 14210000 14186200 444306122144600 14159500 14151000 14206241 11509500 453004122510301 11510700 14162450 14209700 420741121554001 453030122560101 420448121503100 14163000 11509370 14207200 452041119321500 14317600 11507501 420853121505501 420853121505500 421401121480900 14206694 420037121334100 421015121471800 420833121402000 Explanation

* Site operated on a seasonal basis or currently is not operating.
No values are available for the last 6 hours.

The "Real-time" map tracks short-term changes (over several hours) of water quality. Although the general appearance of the map changes very little from one hour to the next, individual sites may change rapidly in response to major rain events or to reservoir releases. The data used to produce this map are provisional.