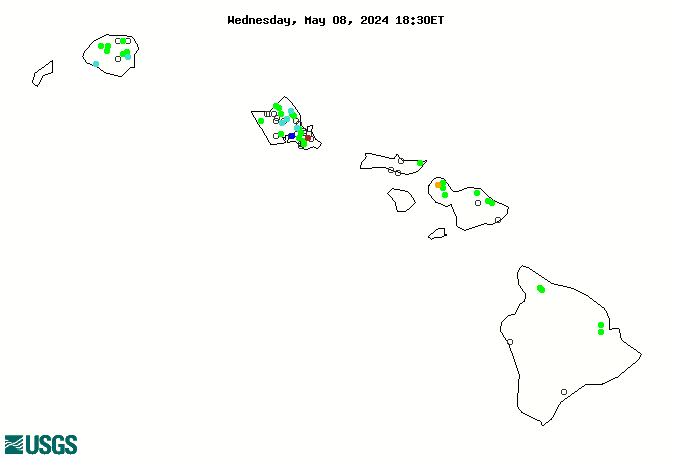
WaterQualityWatch -- Continuous Real-Time Water Quality of Surface Water in the United States

Real-Time Discharge, in cfs

Map of , showing which states provide real-time computed water-quality data
16226200 16704000 16330000 16325000 16301050 16284200 16213000 16031000 16604500 16345000 16304200 16296500 16283200 16275000 16229000 16208000 16200000 16060000 16618000 16725000 16720000 16717000 16620000 16614000 16587000 16518000 16508000 16400000 16254000 16244000 16240500 16238500 16211600 16108000 16097500 16071500 16068000 16019000 16010000 213320158061401 213308158035601 213133158014201 16770500 16759600 16552800 16501200 16415600 16414200 16408000 16294900 16294100 16274100 16265000 16264600 16249000 16247100 16241600 16238000 16227500 16226400 16212490 16210500 16210200 16210100 16210000 16208400 16103000 16094150 16057900 Explanation

* Site operated on a seasonal basis or currently is not operating.
No values are available for the last 6 hours.

The "Real-time" map tracks short-term changes (over several hours) of water quality. Although the general appearance of the map changes very little from one hour to the next, individual sites may change rapidly in response to major rain events or to reservoir releases. The data used to produce this map are provisional.