Home
About USGS WaterQualityWatch
RTWQ FAQ
State Links to Surrogates and Reports
Technical Resources
Other Links
Search USGS Publications
|
|
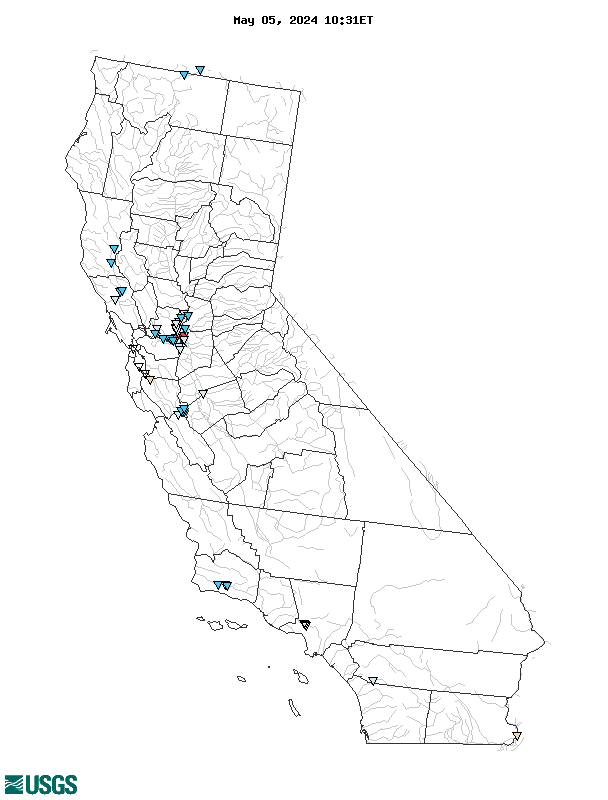
Real-Time Dissolved Oxygen, in mg/L

*
Site operated on a seasonal basis or currently is not operating.
No values are available for the last 6 hours.
The "Real-time" map tracks short-term changes (over several hours) of water quality. Although the general appearance of the map changes very little from one hour to the next, individual sites may change rapidly in response to major rain events or to reservoir releases. The data used to produce this map are provisional. |
