WaterQualityWatch -- Continuous Real-Time Water Quality of Surface Water in the United States

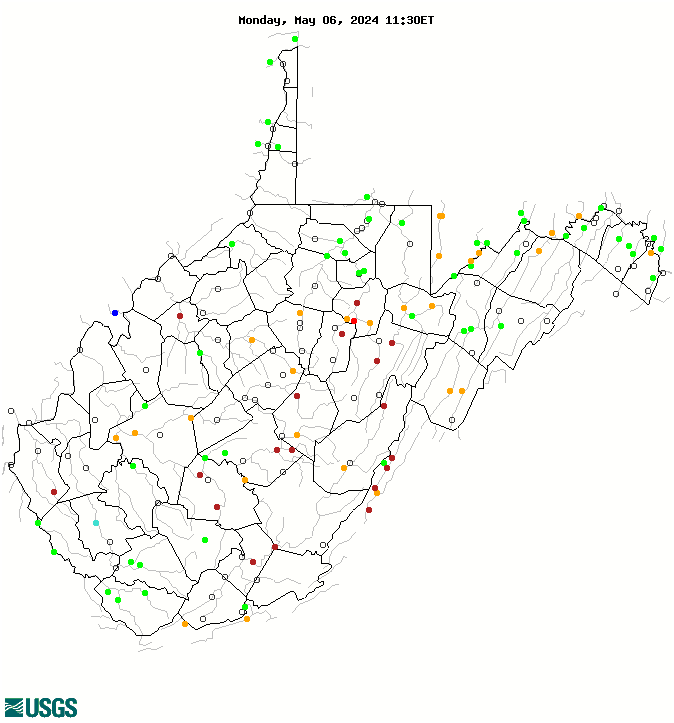
Real-Time Discharge, in cfs

Map of , showing which states provide real-time computed water-quality data
03111548 03111500 03058500 02011800 02011490 02011470 03206600 03200500 03112000 03076600 03076500 03072000 03062500 01619500 01617800 01610155 01604500 03214500 03213700 03213500 03212980 03212750 03203600 03202750 03202400 03201000 03198500 03198000 03197000 03194700 03193000 03192000 03191500 03190000 03189100 03187500 03186500 03185400 03185000 03184000 03183500 03182500 03180500 03179000 03177710 03176500 03175500 03159540 03155220 03155000 03154000 03152000 03151400 03114500 03110000 03109500 03075500 03070500 03069500 03068800 03066000 03065000 03061500 03061000 03057000 03056250 03056000 03054500 03053500 03052500 03052000 03051000 03050000 02011500 02011460 02011400 01636500 01618000 01617000 01616500 01614000 01613000 01611500 01610000 01609000 01608500 01608000 01607500 01606500 01606000 01605500 01603000 01601500 01599000 01597500 01595800 01595500 01595300 01595000 380649081083301 03216000 03215000 03207020 03206000 03204250 03204000 03203000 03202928 03201500 03201405 03198350 03197910 03196800 03196600 03196500 03195500 03189600 03188900 03187000 03184500 03182888 03182050 03178150 03178000 03177480 03177120 03159750 03155405 03153500 03151600 03151550 03151000 03150700 03114280 03112500 03111950 03111520 03111515 03110830 03110690 03071600 03071590 03070260 03067510 03063000 03062450 03062445 03062250 03062245 03062225 03062224 03061430 03058975 03058020 03058000 03057900 03057300 03055500 03052450 03052120 03050500 03049930 01636690 01636464 01618100 01616425 01616400 01616100 01613525 01613095 01613030 01613020 01610400 01610195 01608070 01607300 01606900 01605002 01599200 Explanation

* Site operated on a seasonal basis or currently is not operating.
No values are available for the last 6 hours.

The "Real-time" map tracks short-term changes (over several hours) of water quality. Although the general appearance of the map changes very little from one hour to the next, individual sites may change rapidly in response to major rain events or to reservoir releases. The data used to produce this map are provisional.