WaterQualityWatch -- Continuous Real-Time Water Quality of Surface Water in the United States

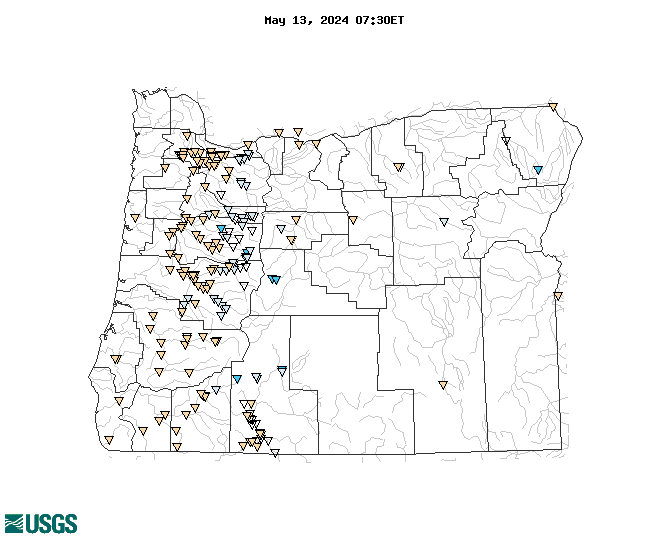
Real-Time Water Temperature, in °C

Map of , showing which states provide real-time computed water-quality data
14170000 14173500 14211542 14322810 14201340 14169000 10382000 14123500 14097100 14337500 14306500 14076500 420448121503100 14207770 14034500 14159110 14165000 11509500 14400000 14181500 14320934 14046778 14150000 13333000 14164550 14327000 14145500 14148000 14091500 14165500 14317600 14359000 14305800 14147500 14152500 14210750 14183020 11510700 14307620 14158850 14087400 14182500 13317660 14316700 14326300 14181350 14369500 14162050 11507500 14211499 14312000 14327150 14308000 14372300 14078260 14105700 14158100 14158050 14310000 14155500 14166000 14188570 420451121510000 453630122021400 14149011 14113000 14378200 14185800 14159405 14307605 14150800 14209710 14201500 14187000 14211500 14033500 14151000 14140020 14339000 14185900 14318000 14321000 14171600 14362000 14337600 14166500 14316500 14186200 14163900 14154500 14162450 14306950 14184100 14144900 14316460 14187200 14190500 11504260 14161500 11509370 14171000 420741121554001 14162500 13269000 14377100 14190610 14306032 14185000 14187500 14305500 14164700 14335072 14161100 14181650 14200000 14141500 14211400 14198500 14188800 14180520 14163150 14139800 14192015 14211550 14361500 13213000 14144800 14103000 14189050 14199704 14181900 14205350 14338000 14188750 14300350 14326510 14164900 14319500 11504115 14152000 14366000 14302900 14153500 14163000 14138870 11492550 14180300 13331500 14144790 14043840 14185600 14070621 14038530 14330000 11493100 14178000 14158500 14178500 14159130 14044000 11503000 11491950 13325000 11491450 14138900 10396000 14209500 14174450 14034470 14070624 14070620 14158798 11491470 14070900 14188610 14179000 14158790 14158740 14070615 14178610 14150250 443531122203900 14211720 422622122004003 14317450 14312330 443502122240500 14202980 443317122252600 422305121553803 420037121334100 421935121551200 421015121471800 420853121505500 452731123092100 14178430 11507501 443519122225800 422444121580400 14207200 422719121571400 444653121571200 14206241 443340122250500 443342122250200 14147200 452041119321500 444306122144600 420535121143800 14178620 142063391 14078240 453030122560101 14158977 14206340 14150290 14203500 14092500 14174000 444649121594701 14178470 422305121553800 420833121402000 443935121571700 422042121513100 14208300 420024121132800 14144780 453004122510301 453040123065201 14206339 14206752 142063398 14202650 444238122065700 14178490 443517122221800 443404122240500 443253122255000 443348122244400 14211010 421401121480900 14209700 444809122265500 443226122260700 14208000 14185865 14206694 452230122512201 14206950 14178440 14210000 14197900 14308910 422622122004000 420853121505501 14184300 14159100 Explanation

* Site operated on a seasonal basis or currently is not operating.
No values are available for the last 6 hours.

The "Real-time" map tracks short-term changes (over several hours) of water quality. Although the general appearance of the map changes very little from one hour to the next, individual sites may change rapidly in response to major rain events or to reservoir releases. The data used to produce this map are provisional.