Special Features

Streamflow -- Water Year 2021

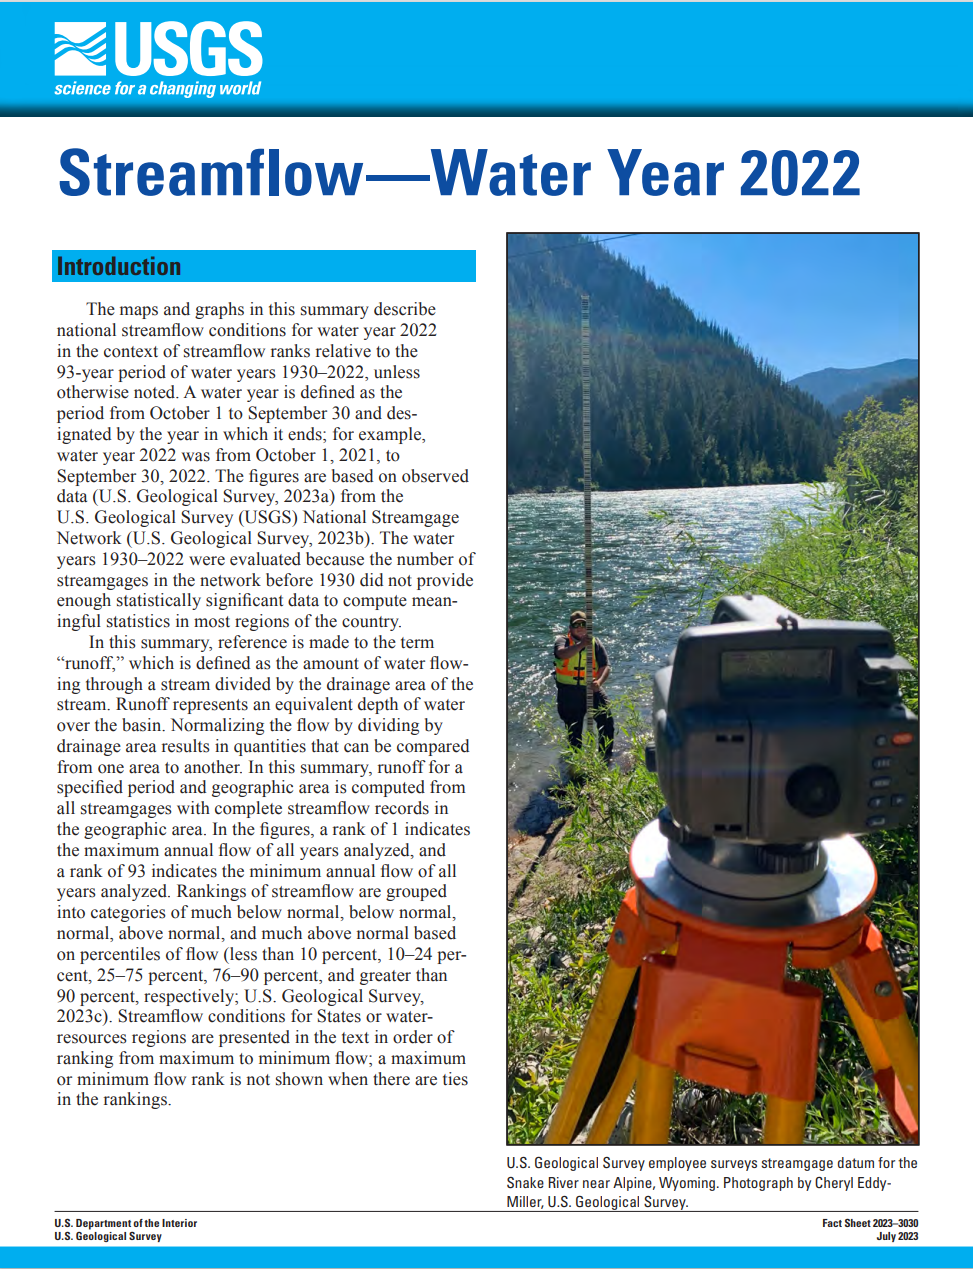
The maps and graphs in this summary describe national streamflow conditions for water year 2021 (October 1, 2020, to September 30, 2021) in the context of streamflow ranks relative to the 92-year period of water years 1930–2021.

2021 water-year summary

Flow Duration Curve

Create a USGS flow duration curve dynamically. Choose USGS streamgage and specify the beginning and ending dates to create a curve

Duration curve and click to view a large image with more options

Duration Hydrograph with backdrop of monthly flow percentiles

Present a time-history streamflow along with backdrop of monthly-flow percentiles.
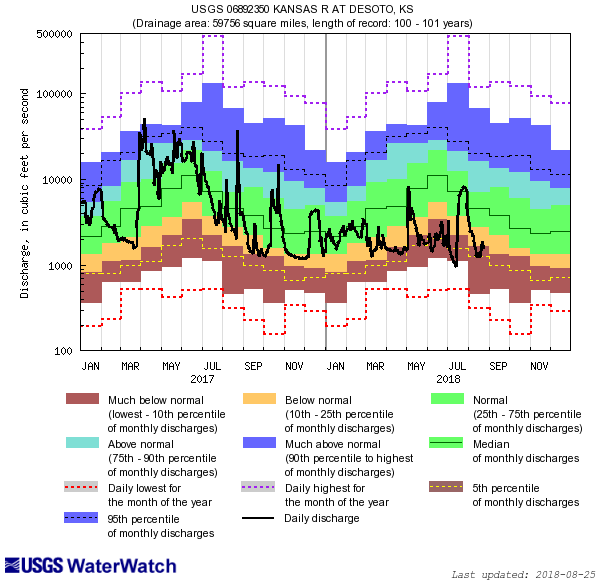
Duration Hydrograph and click to view a large image with more options

Streamflow Map

View all streamflow condition maps in a seamless way. Provide tools for quick zooming, panning, and full screen. Search USGS streamgages easily by state, huc, and site name and number.
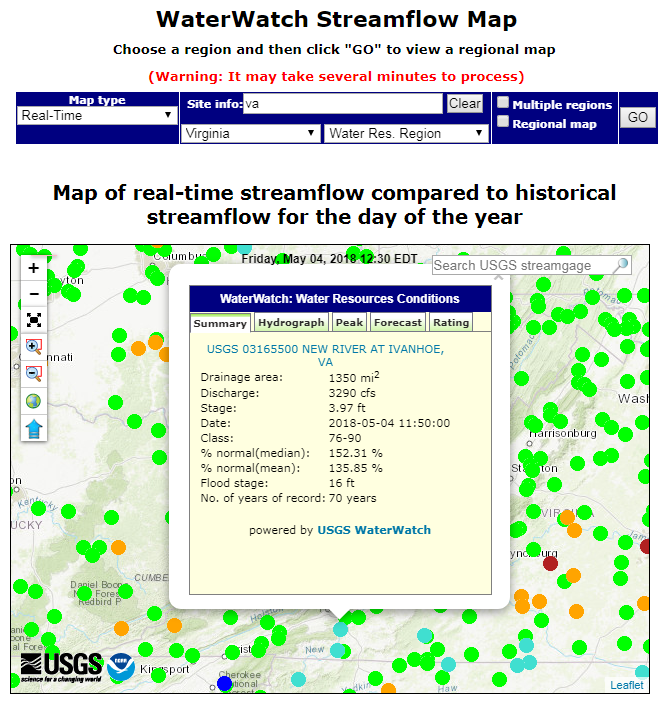
Dynamic map

Streamgage Dashboard

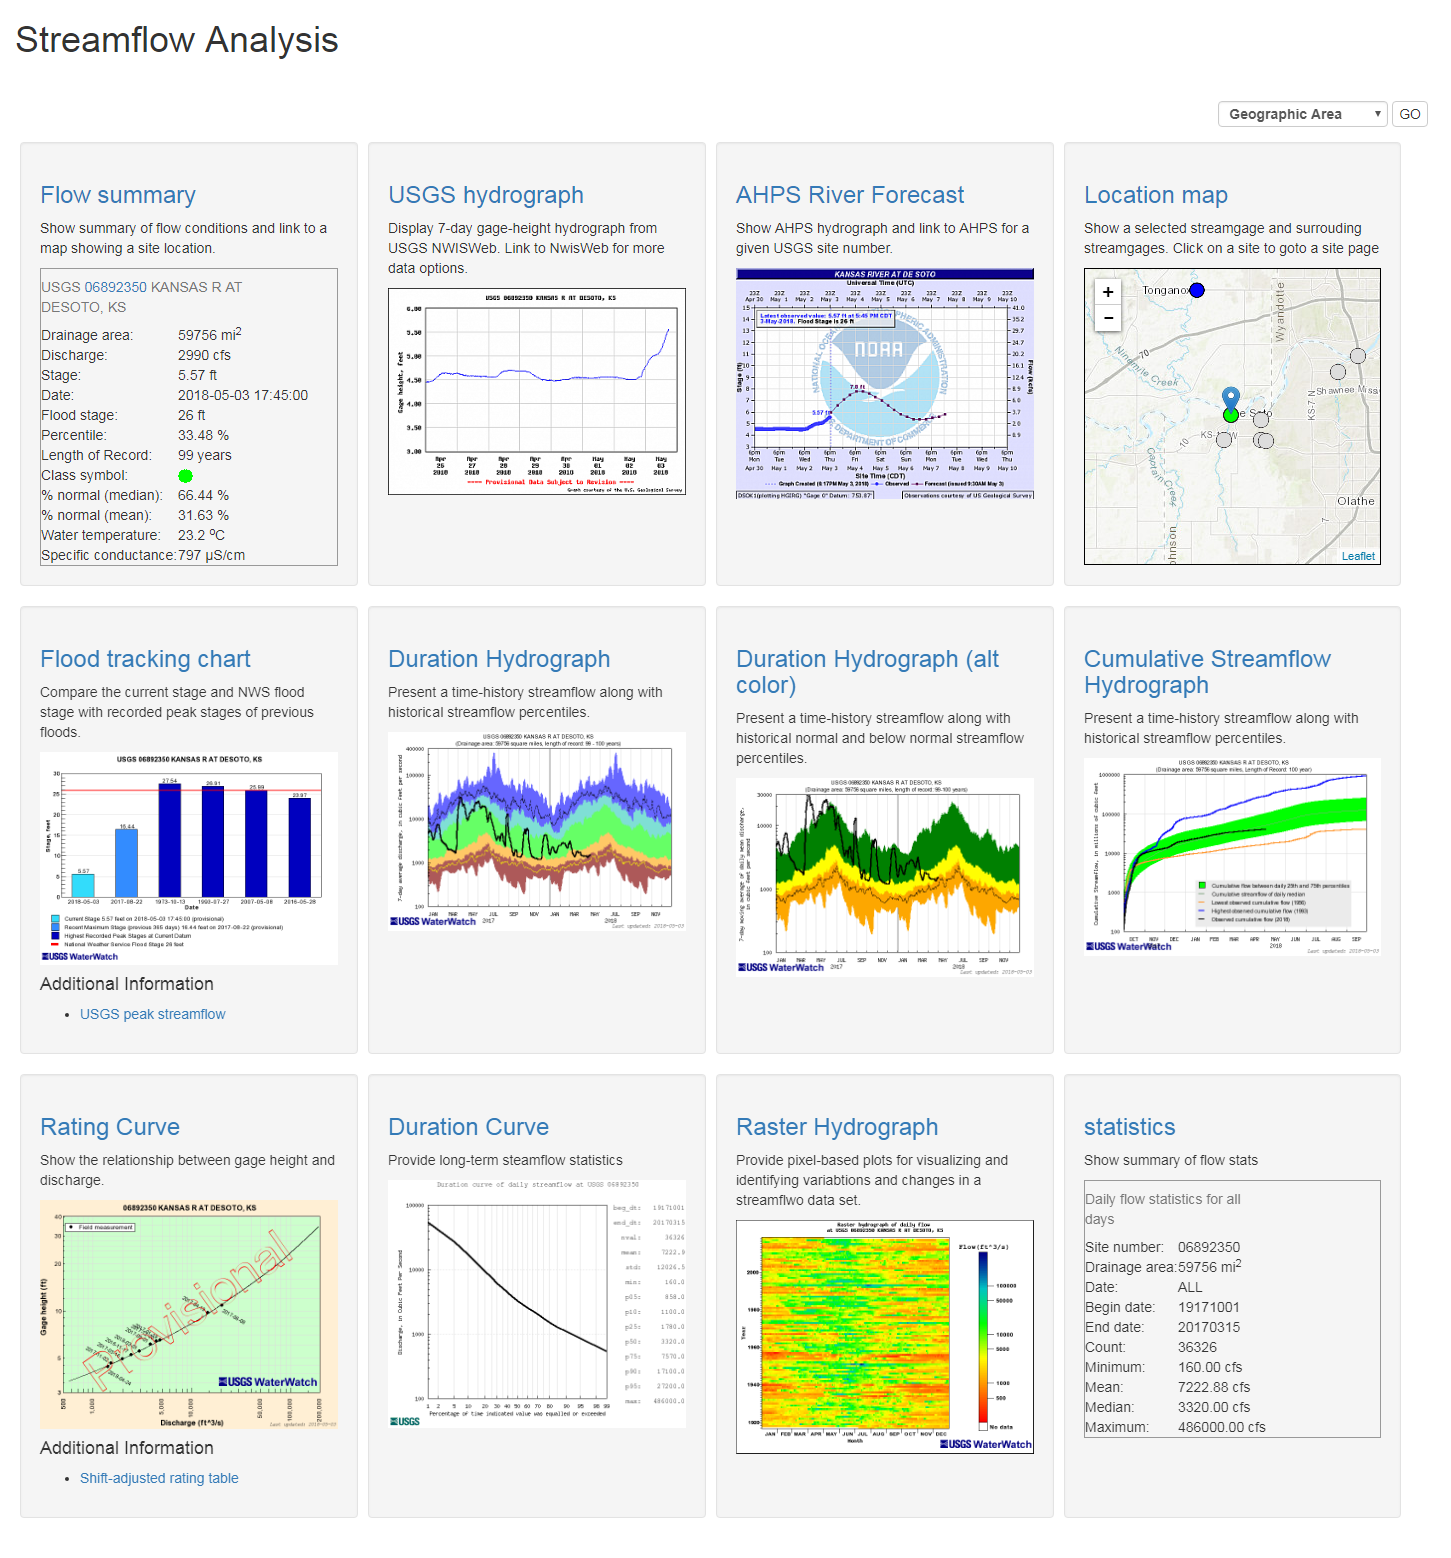
Collection of WaterWatch popular streamflow analysis tools for a streamgage.

WaterWatch streamgage dashboard

State Streamflow Dashboard

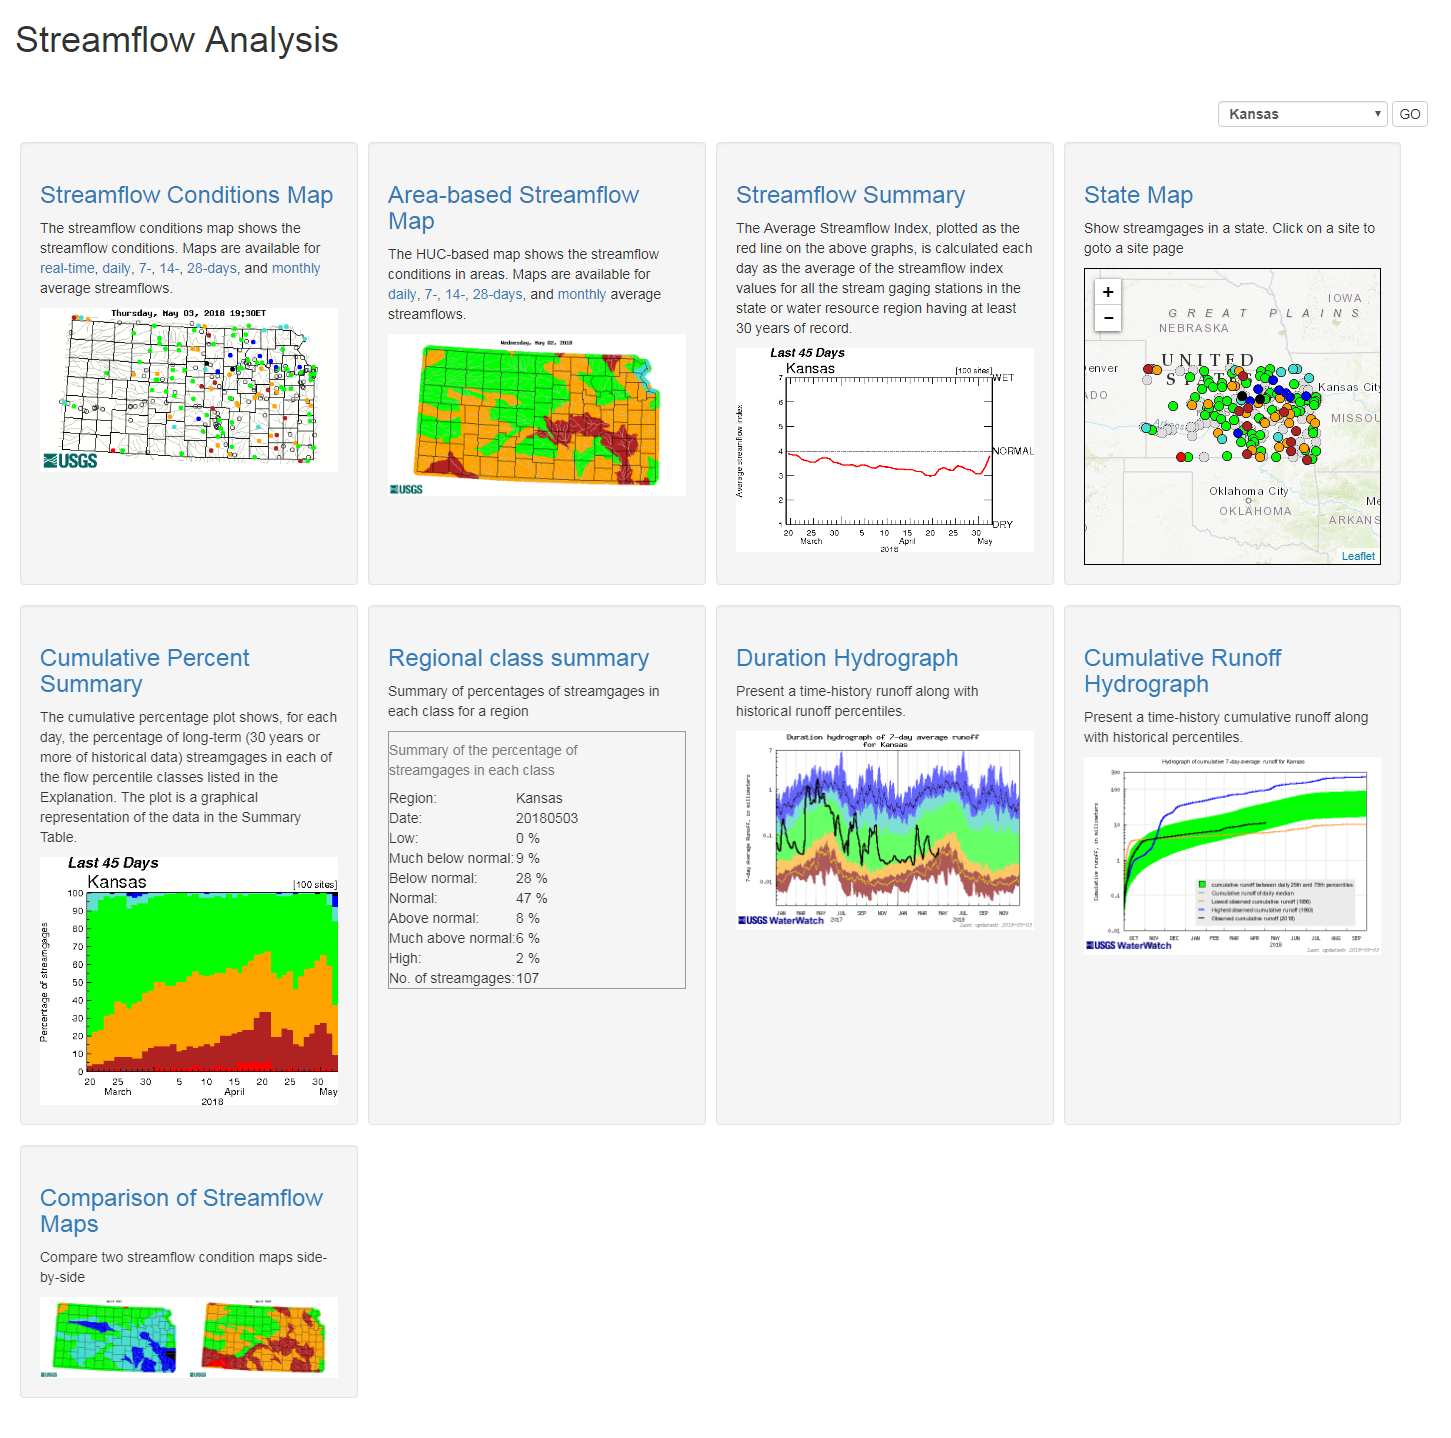
Collection of WaterWatch streamflow analysis tools for a state.

WaterWatch state-streamflow Analysis

Data Services

Data services for all WaterWatch streamflow data and flow statistics

WaterWatch data services

Map Shapefile

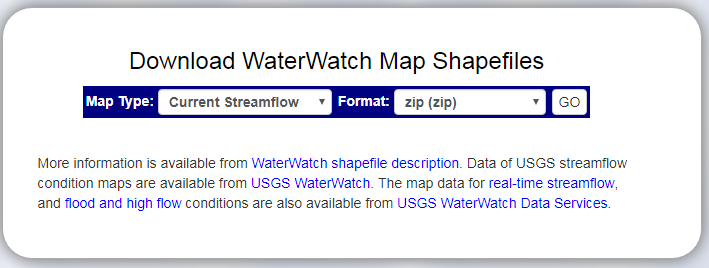
Download WatrWatch streamflow condition maps in shapefiles.

Map shapefile download

Map Data

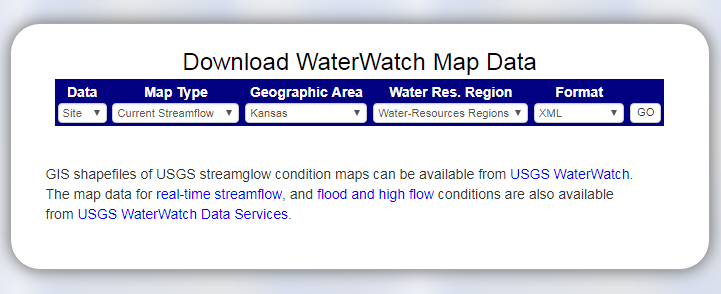
Download WatrWatch map data in various formats such as XML and KML.

Map data download