WaterQualityWatch -- Continuous Real-Time Water Quality of Surface Water in the United States

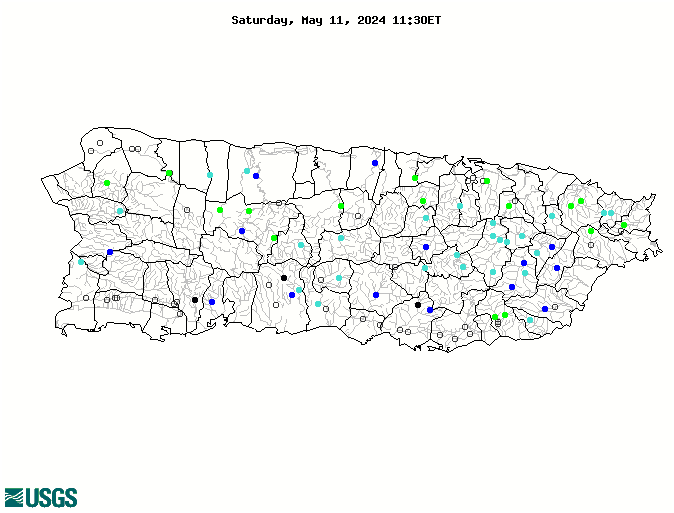
Real-Time Discharge, in cfs

Map of , showing which states provide real-time computed water-quality data
50100200 50055380 50051310 50144000 50138000 50126150 50124200 50114000 50100450 50059050 50056400 50055225 50055000 50053025 50136400 50112500 50106100 50092000 50071000 50065500 50063800 50058350 50057000 50050900 50046000 50045010 50044810 50043800 50043000 50039500 50034000 50028000 50027000 50026025 50025155 50024950 50021700 50147800 50114900 50113800 50111500 50110900 50093000 50090500 50083500 50081000 50075000 50067000 50064200 50061800 50055750 50051800 50049100 50047850 50047560 50047535 50035000 50028400 50027600 50014800 50011200 182743067004200 50129254 50128948 50128945 50128940 50128933 50128925 50128920 50128907 50128905 50115240 50111340 50111330 50111320 50110650 50095000 50093120 50093115 50093110 50093090 50093084 50093083 50093078 50093075 50093053 50085100 50075500 50070900 50059210 50049620 50049310 50048565 50043980 50043197 50039995 50031000 50011180 50011128 50011085 50011000 50010500 Explanation

* Site operated on a seasonal basis or currently is not operating.
No values are available for the last 6 hours.

The "Real-time" map tracks short-term changes (over several hours) of water quality. Although the general appearance of the map changes very little from one hour to the next, individual sites may change rapidly in response to major rain events or to reservoir releases. The data used to produce this map are provisional.