WaterQualityWatch -- Continuous Real-Time Water Quality of Surface Water in the United States

Real-Time Discharge, in cfs

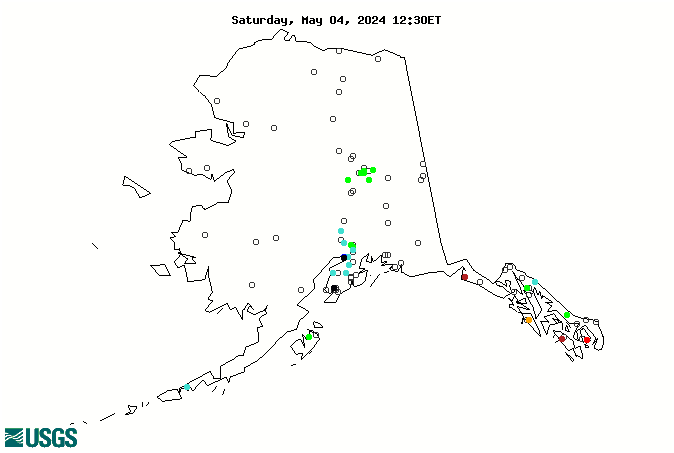
Map of , showing which states provide real-time computed water-quality data
15274600 15072000 15276000 15275100 15271000 15239070 15129500 15081497 15297610 15294005 15292700 15281000 15266300 15261000 15258000 15041200 15088000 15515500 15514000 15511000 15493700 15493000 15484000 15295700 15290000 15284000 15052500 15024800 15980000 15908000 15905100 15896000 15875000 15747000 15744500 15743850 15621000 15580095 15565447 15564879 15519100 15515060 15515048 15502000 15493400 15485500 15478040 15477740 15457790 15453500 15356000 15348000 15320100 15304010 15304000 15303900 15302000 15300300 15297475 15293200 15292000 15283700 15278000 15272502 15266110 15243900 15239900 15239060 15239050 15239001 15238990 15238986 15238648 15238500 15237730 15236900 15227090 15226620 15215900 15214000 15209700 15200280 15129120 15101490 15087700 15086225 15068040 15057596 15056500 15056210 15055500 15052000 15019990 15015595 15008000 Explanation

* Site operated on a seasonal basis or currently is not operating.
No values are available for the last 6 hours.

The "Real-time" map tracks short-term changes (over several hours) of water quality. Although the general appearance of the map changes very little from one hour to the next, individual sites may change rapidly in response to major rain events or to reservoir releases. The data used to produce this map are provisional.