State Dashboard
Streamflow Conditions Map
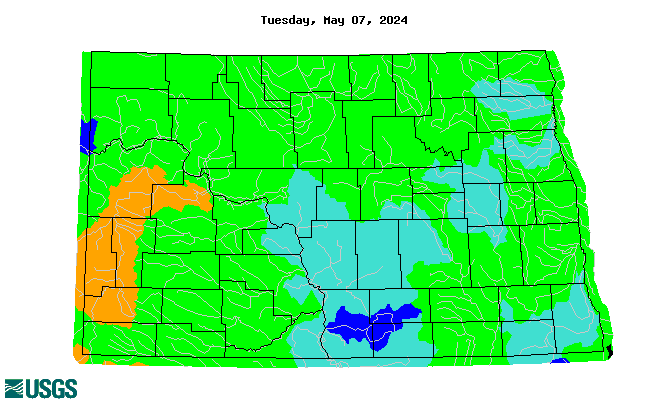
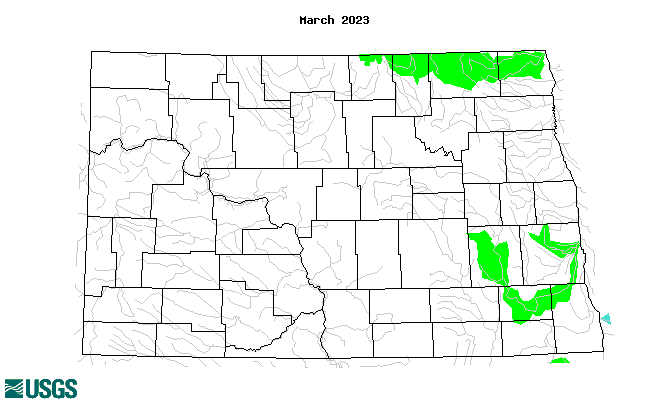
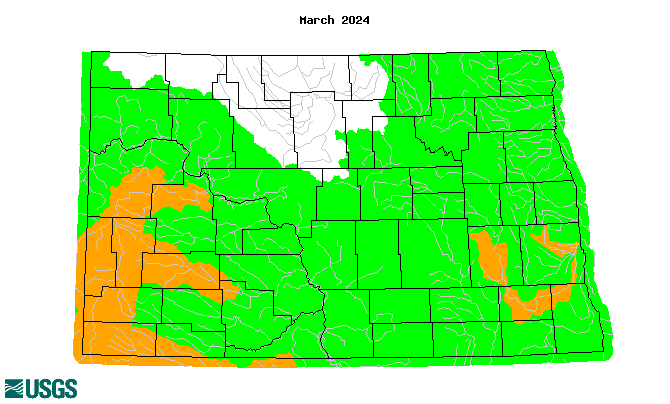
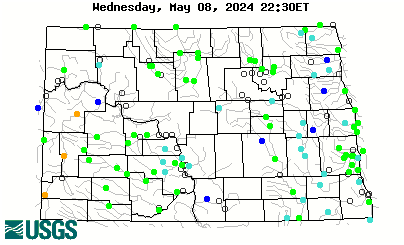
The streamflow conditions map shows the streamflow conditions. Maps are available for real-time, daily, 7-, 14-, 28-days, and monthly average streamflows.
Additional Information
Streamflow Summary
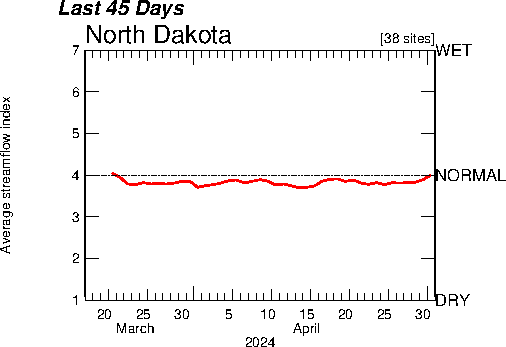
The Average Streamflow Index, plotted as the red line on the above graphs, is calculated each day as the average of the streamflow index values for all the stream gaging stations in the state or water resource region having at least 30 years of record.
Cumulative Percent Summary
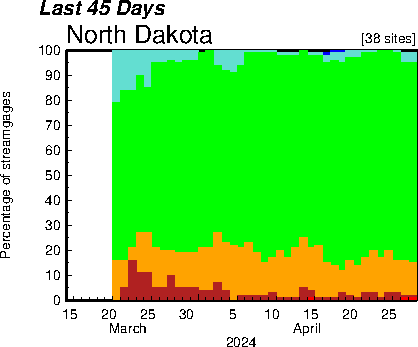
The cumulative percentage plot shows, for each day, the percentage of long-term (30 years or more of historical data) streamgages in each of the flow percentile classes listed in the Explanation. The plot is a graphical representation of the data in the Summary Table.
Regional class summary
Summary of percentages of streamgages in each class for a region
| Region: | North Dakota |
| Date: | 20240418 |
| Low: | 0 % |
| Much below normal: | 1 % |
| Below normal: | 13 % |
| Normal: | 82 % |
| Above normal: | 3 % |
| Much above normal: | 1 % |
| High: | 0 % |
| No. of streamgages: | 76 |
Cumulative Runoff Hydrograph
Present a time-history cumulative runoff along with historical percentiles.
