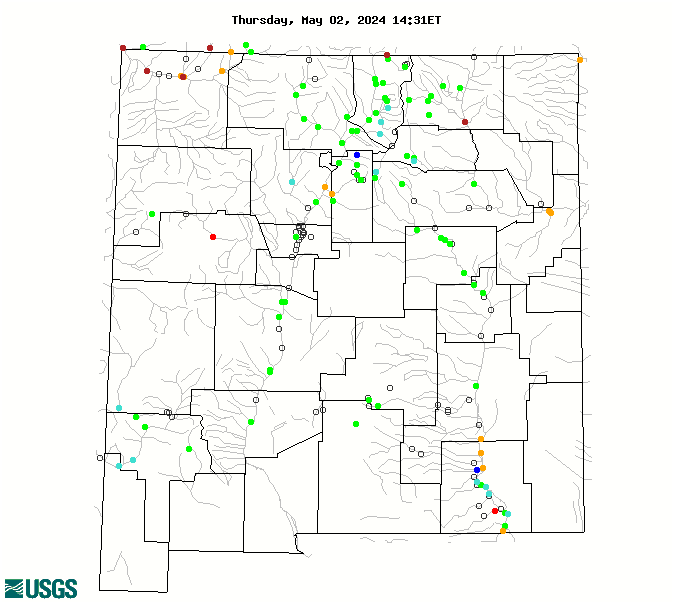
WaterQualityWatch -- Continuous Real-Time Water Quality of Surface Water in the United States

Real-Time Discharge, in cfs

Map of , showing which states provide real-time computed water-quality data
08408500 08398500 08395500 08382000 09432000 08407000 08405150 08390800 08380500 08329900 08289000 07208500 09354500 09349800 08402000 08401500 08385522 08330000 08313000 08290000 08287000 08271000 08477110 08343500 08317400 07207000 07206000 08407500 08406500 08405200 08396500 08390500 08387000 08382500 08353000 08330775 07222500 07221500 07216500 07215500 07211500 09431500 09386900 09371010 09368000 09367500 09365000 09364500 09363500 09346400 08403500 08316000 08314000 08313500 08286500 08269000 08267500 09444000 09430500 09355500 08481500 08405500 08399500 08387600 08386000 08385000 08384500 08383500 08382830 08382650 08379500 08378500 08377900 08361000 08358400 08358300 08354900 08332010 08324000 08317200 08302500 08294210 08291000 08285500 08284100 08279500 08279000 08277470 08276500 08276300 08275500 08266820 08265000 08263500 08255500 08254000 08253500 08253000 08252500 07227100 07227000 07218000 07207500 07203000 07202500 083299377 09439000 09430600 09430030 09430020 09430010 09386950 09371000 09367580 09367540 09367000 09364010 08480595 08480594 08406000 08405450 08405105 08404000 08403800 08401900 08401450 08401200 08400000 08397620 08397600 08393610 08390620 08390610 08389055 08387550 08386505 08385630 08385503 08384000 08382810 08382600 08359500 08355490 08355050 08341400 08331510 08331160 08330875 08330600 08330200 08329928 08329918 08329884 08329870 08329840 08329835 08329720 08329700 08328950 08328500 08319000 08317950 08317900 08317300 08316500 08315500 08315480 08308050 08294200 08286900 08282300 08281400 08261000 08253900 07226500 07223500 07214680 07214670 07214470 07205500 07199450 Explanation

* Site operated on a seasonal basis or currently is not operating.
No values are available for the last 6 hours.

The "Real-time" map tracks short-term changes (over several hours) of water quality. Although the general appearance of the map changes very little from one hour to the next, individual sites may change rapidly in response to major rain events or to reservoir releases. The data used to produce this map are provisional.